Understanding DWARF - Variables
If you are involved in developing a debugger you need to understand at least some basics of the DWARF standard. During the build process a tool chain generates debug information to be used later in the debug phase. This information consists on names, positions, size of variables and functions, etc etc. Anything needed to identifying what every bit of a running program. This information is put in the final ELF file, and has a standard format, whose name is DWARF. DWARF is not the only one, there are others. But in AURIX world you will be dealing only with DWARF.
Here you can find a great introduction to DWARF.
Reading local and global variables from a running AURIX device
I decided to start with understanding how the debuggers are able to display the values of local and global variables. In my exploration I am pretending to be a debugger, which gets an ELF file as input, and the ability to read memory and registers from a running device.
Setup
- AURIX Development Studio to write test programs and flash the device
- MCD Basic Client to control and read a running device.
- AURIX TC375 lite kit
- dwarfdump.exe, which you get by building libdwarf
- TriCore GCC Compiler
- WSL
Test program
I created a very simple test program with a global variable, a local variable, a function call, and input parameter and an output:
int a = 0;

int my_func(int x);

void core0_main(void)
{
    int b = my_func(a);
    a = b;

    while(1)
    {}
}

int my_func(int x) {
   int y = x+1;
   return y;
}
Locating the variables
Global variables
Imagine you are the debugger, and you need to fetch the value of the variable int a. You need to search for its address in memory.
This process is called “locating the variable”.
It is now time to use the DWARF data we got in the elf file.
Let’s first dump it out to a text file we car read and search.
C:\dev\dwarf>dwarfdump.exe "C:\Users\bragante\AURIX-v1.9.0-workspace\TestDWARF\External GCC - Debug\TestDWARF.elf" > TestDWARF.elf.txt
Now, we are going to search in vim using the following pattern: DW_AT_name\s*a\n. We are basically searching for the string DW_AT_name a, which identifies a DWARF Debug Information Entry (DIE) for the symbol a.
If we count the occurrences (%s/DW_AT_name\s*a\n//gn) we get: 16 matches on 16 lines. This happens because our program is not the only one that decided to use a as variable name, and we imported a lot of standard library and Low Level Drivers in our program.
We are interested only in the a variable which is contained in the Cpu0_Main.c
Here it is:
< 1><0x00000367>    DW_TAG_variable
                      DW_AT_name                  a
                      DW_AT_decl_file             0x00000001 C:/Users/...
                      DW_AT_decl_line             0x0000001f
                      DW_AT_decl_column           0x00000005
                      DW_AT_type                  <0x0000012b>
                      DW_AT_external              yes(1)
                      DW_AT_location              len 0x0005: 0x030c000070:
                          DW_OP_addr 0x7000000c
I am not going to analyze every line of this DIE, but only the one which are interesting to our use case.
First, < 1> tells us that this DIE is not a children of another DIE, but it is at “level 1” in the translation unit. This makes sense, since a is a global variable. Scrolling up a bit let us found the translation unit information:
COMPILE_UNIT<header overall offset = 0x000645f5>:
< 0><0x0000000c>  DW_TAG_compile_unit
                    DW_AT_producer              GNU C99 11.3.1 20221026 -mtc162 -g3 -O0 -std=c99 -fmessage-length=0 -fno-common -fstrict-volatile-bitfields -fdata-sections -ffunction-sections
                    DW_AT_language              DW_LANG_C99
                    DW_AT_name                  ../Cpu0_Main.c
                    DW_AT_comp_dir              C:\\Users\\bragante\\AURIX-v1.9.0-workspace\\TestDWARF\\External GCC - Debug
                    DW_AT_ranges                0x00000593

      Offset of rnglists entries: 0x00000593
      [ 0] start,end             0x80000a12 0x80000a3e
      [ 1] start,end             0x80000a3e 0x80000a58
      [ 2] end of list
                    DW_AT_low_pc                0x00000000
                    DW_AT_stmt_list             0x00009852
                    DW_AT_macros                0x0002c81c
Note the < 0> at the beginning of the first line. The a variable DIE is a child of the Compile Unit Cpu0_Main.c.
Back to the a variable, we can know the type looking at the attribute DW_AT_type, which refers to the DIE with id 0x12b:
< 1><0x0000012b>    DW_TAG_base_type
                      DW_AT_byte_size             0x00000004
                      DW_AT_encoding              DW_ATE_signed
                      DW_AT_name                  int
Nothing fancy here, die DIE tells us that a is a 4 bytes wide signed integer.
More interesting is the tag DW_AT_location, which informs us that the variable is placed at address 0x7000000c.
This is a global variable, which is just placed into memory and stays there forever.
If we want to double check this, we can peek into the Map file generated by the linker:
.bss.a         0x7000000c        0x4 ./Cpu0_Main.o
               0x7000000c                a
We can see the linker placed a in the bss section (Block Started by Symbol, where all static variables are placed, which gets initialized to zero when the program starts) at address 0x7000000c. All good.
Local variables
Let’s try a local variable now: int y inside the function my_func. This is a local variable, which exists only during the execution of the function. Properly said, the scope of the variable y is the function my_func.
Searching for y in the map file will return us no results, because the linker does not have to reserve memory for it at all.
In order to understand this variable, let’s first look at some assembly code generated by the compiler for the function my_func.
int y = x+1;
80000a46:	19 ef f4 ff 	ld.w %d15,[%a14]-12
80000a4a:	c2 1f       	add %d15,1
80000a4c:	59 ef fc ff 	st.w [%a14]-4,%d15
We can see that to perform the operation x+1 and assign the result to y, the following operations are performed:
- the value of the argument
xis loaded into data register 15 from the address contained in address register 14 with an offset of 12. - the content of
d[15]is incremented by 1 - the content of
d[15]is stored in the memory address contained in a[14] with a offset of 4.
So the variable y lives in the memory at the address pointed by a[14] with an offset of 4. Where do we see that this variable is scoped to its parent function? Well, if you look at the TriCore TC1.6.2 core architecture manual Volume 1, chapter 3.1, you would see that a[14] is a General Purpose Register which belongs to the “Upper Context”. The Upper Context is a set of registers which are automatically (by hardware) saved in the Context Save Area before a function call, and restored before a function return. This means that immediately before my_func returns, a[14] is overwritten with the value saved by its calling function. This is the moment where the variable y dies, because its address in memory is lost.
Let’s now find out what the DWARF data is telling us about this variable:
< 2><0x000003a2>      DW_TAG_variable
                        DW_AT_name                  y
                        DW_AT_decl_file             0x00000001
                        DW_AT_decl_line             0x0000002f
                        DW_AT_decl_column           0x00000008
                        DW_AT_type                  <0x0000012b>
                        DW_AT_location              len 0x0002: 0x8e7c:
                            DW_OP_breg30-4
We see that y shares the same type of the global variable a, but the location is this time something quite different. Reading the DWARF standard helps us to understand that DW_OP_breg30-4 means: The variable is contained in the memory at the address contained in the register assigned to the number 30, minus an offest of 4. This makes already a bit of sense. We already met the -4 offset. But what is the “register assigned to the identifier 30”? Again, the DWARF standard states that this information is to be searched in the Instruction Set Architecture (ISA) of the platform we are working on. In other words, DWARF states that some registers with certain IDs exist, and the hardware vendor decides which register to assign to which DWARF ID. Looking at the Infineon TriCore EABI, paragraph 4.5.1, will give us the answer we need. The address register A[14] is given the DWARF register number 30.
Temporal locality of int y
The debugger (we) now knows where to read the value of y from. But it still doesn’t know when. We already found out this variable has a life limited to the life of my_func. Actually, the DWARF information tells us the same. The DIE of y is at deep < 2>, with my_func being its parent.
If we look for at the DIE of my_func we see the following two tags:
DW_AT_low_pc                0x80000a3e
DW_AT_high_pc               <offset-from-lowpc> 26 <highpc: 0x80000a58>
So we know that when the program counter is set to any address between 0x80000a3e and 0x80000a58, the function my_func is being executed, and it makes sense to read the value of the variable y.
In the next post I am going to cover how parameters are passed from the caller to the callee and back.
Debugging a running device
Let’s use MCD Basic Client to perform a small debug session. Target of this session is to read the value of a and the value of y during my_func execution.
The address of a[14]
In the TriCore architecture every register is assigned an address, which allows to read its content programmatically or using a debugger.
There are two classes of registers: Special Function Registers (SRFs) and Core Special Function Registers (CSFRs)every register is assigned an address, which allows to read its content programmatically or using a debugger.
There are two classes of registers: Special Function Registers (SRFs) and Core Special Function Registers (CSFRs). A[14] belongs to the second category. The AURIX TC3xx User Manual part 1 tells us that the base address for all CSFRs of the CPU0 is 0xF881000. The AURIX TC3xx Architecture Vol. 1 tells us that the offset of A[14] is 0xFF80+n*4, where n=14.
A[14] address is then 0xF8810000 + 0xFF80+E*4 = 0xF881FFB8.
Now we have everything we need to start our debugging session.
Placing breakpoints
We will place two breakpoints. The first at the beginning of my_func, and the second on the while(1), right after all calculations have been performed.
DWARF tells us we have to place the first breakpoint at address 0x80000a3e (entry point of my_func), and the second at address 0x8000a3c.
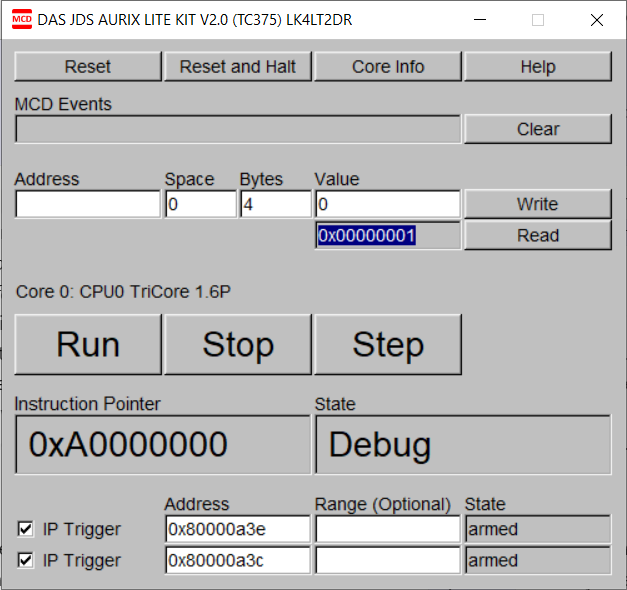
MCD Basic Client looks like this:

The two breakpoints are set and armed, the device is halted at 0xA0000000 and ready to run.
We press “Run” and the first breakpoint is hit, which means the execution of my_func just started. We can now read the value of a by reading its address in memory (0x7000000c), which is 0 as expected:
To read the value of y we read a[14], we subtract 4 and we use the value we get as address to read again:
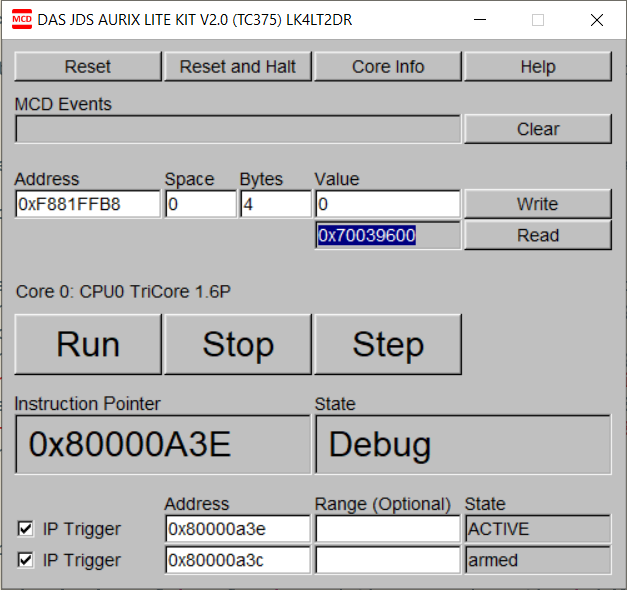

Also the value of y is zero at this point.
Now we let the execution hit the next breakpoint, and read the value of a:
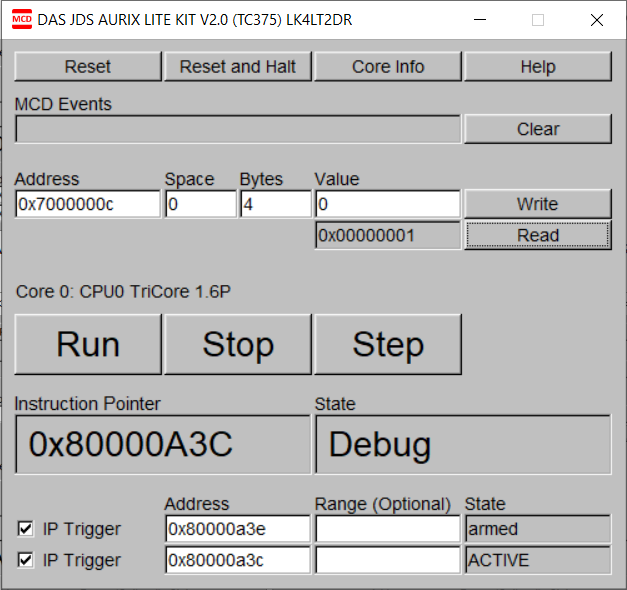
And we see that its value has been correctly set to one.